
■︎ This text was not generated by AI.
Every year growth managers and marketers plan their budgets for the upcoming cycle. A core part of the planning process is forecasting, i.e. how much revenue, signups, activations, etc. can we drive by pushing X more dollars, people, compute power, etc. into a given channel? And like all predictions, it’s never an exact science. Usually however, forecasting is easier to do when inputs have a stronger correlation with a desired output, such as in direct-response ad campaigns. Over the years, I have seen many different approaches to forecast ROI of ad campaigns. Everything from guessing, simple heuristics, linear extrapolation, to really complex statistical models - why else are there data scientists, right?
I want to show you a data-driven forecasting method called Efficient Frontier that is easy for most teams to understand and works well for these simple budget planning scenarios. The approach is commonly used in modern portfolio theory to optimize the allocation of investments across multiple assets. In marketing, this could be similarly extended to plan optimal budget allocations across different marketing channels (e.g. paid search, paid social, youtube ads, etc.). In this article, I will illustrate the approach by planning a single performance marketing budget.
Understanding the Efficient Frontier
The Efficient Frontier approach helps you find the best possible outcome you can achieve for a specific level of investment by analyzing the relationship between your input (ad spend) and output (clicks, impressions, or conversions). By visualizing the relationship between these metrics you can make more accurate predictions about future performance. In most cases, you will notice a pattern of diminishing marginal returns with increasing ad spend. If this pattern does not show, you either have not reached diminishing returns yet (and could try to scale further) or you have not collected enough data points to get a conclusive picture.
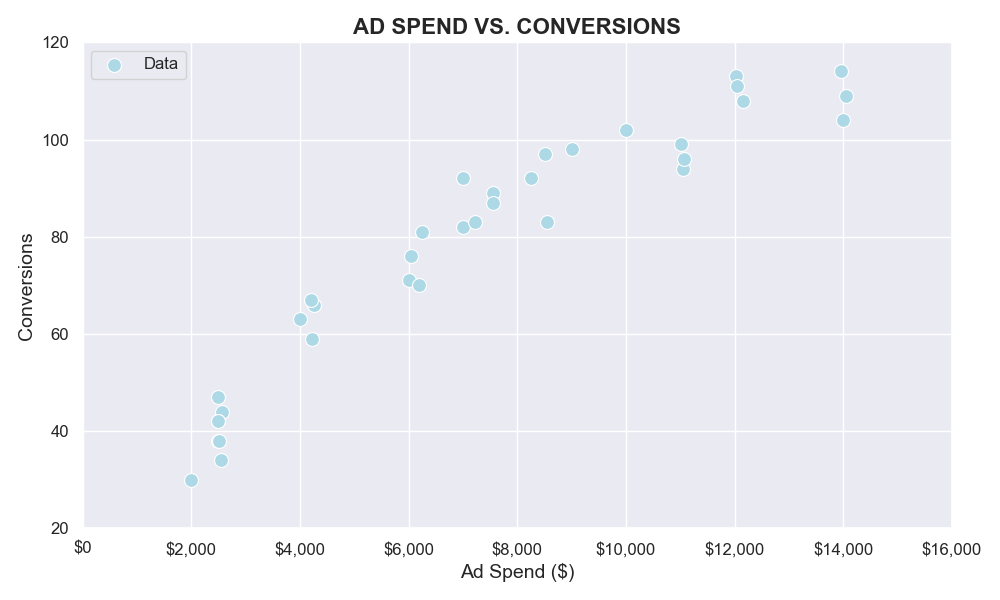
Let’s take a look at an Google Ads example. The following charts are based on a dataset of daily conversions and corresponding ad spend from a paid search campaign. It contains multiple datapoints at various spend levels that was collected over a period of time. Visualizing this data in a scatter plot looks like this:
If we add a fitted curve for this scatter chart (green), the plot would look like below. It shows a typical diminishing return curve: As ad spend increases, each additional dollar invested yields a decreasing number of incremental conversions.
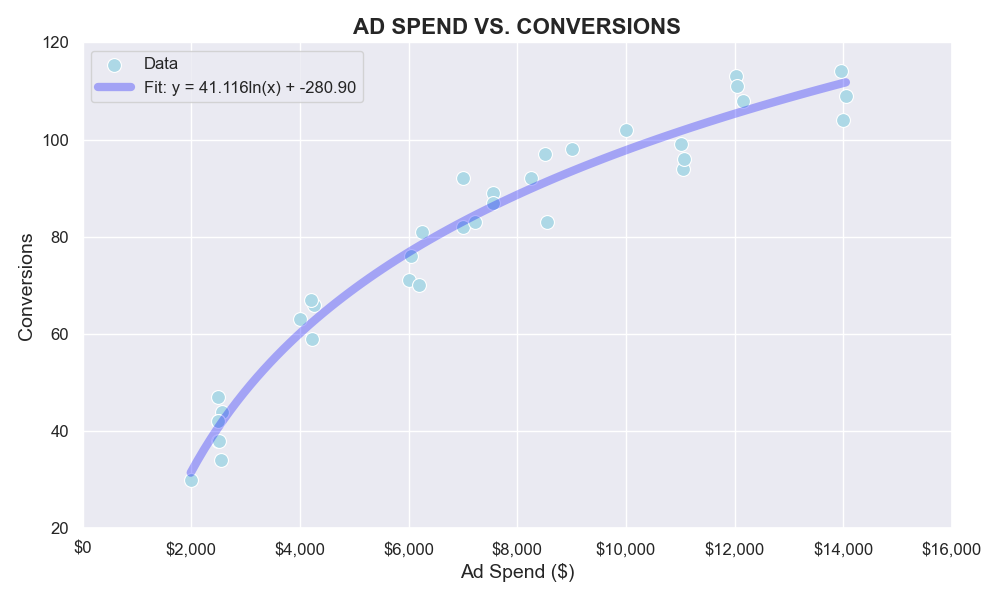
For example:
- $4,000 in ad spend results in approximately 60 conversions.
- Doubling the spend to $8,000 only increases conversions to about 90.
This happens for a few reasons: 1/ Ad platforms tend to start by securing the most effective, lowest-cost impressions and conversions from the lowest-hanging fruit audiences and ad inventory. 2/ As we ramp up ad spend, the algorithm is forced to buy more expensive, less efficient impressions and exhaust the best performing audiences/placements. 3/ Other factors like audience saturation, pre-set floor pricing, and competition can also drive diminishing returns at higher spend levels.
Forecasting: Let’s be more data-driven now.
With an Efficient Frontier plot using your own paid campaign data like in the example above, you can now realistically forecast potential results at different spend levels. In our example plot, you could find the $4,000 ad spend level on the x-axis, trace up to the curve to forecast around 60 conversions, and calculate metrics like CPA or projected revenue based on those forecast conversions. This allows you to set achievable performance targets instead of overestimating linearly.
Or you can do this the other way around by working backwards from a target CPA, e.g. setting the maximum efficient CPA based on the curve, and calculate the required spend level to hit that target. In our example, if the efficient frontier analysis shows acquisition costs increase above \$90 CPA at the \$8,000 per month spend level for LinkedIn Ads, you can set a \$7,500 budget to maintain \$85 CPAs. The optimal ad spend level depends on your specific goals, such as maximizing conversions within a given budget or achieving a target CPA. By analyzing the shape of the efficient frontier curve and the diminishing returns pattern, you can make more informed decisions about setting budgets and performance targets that are realistic and achievable based on your historical data.
For those who want to see how their curve looks, here is a basic app to help visualize this with your own data: LINK.
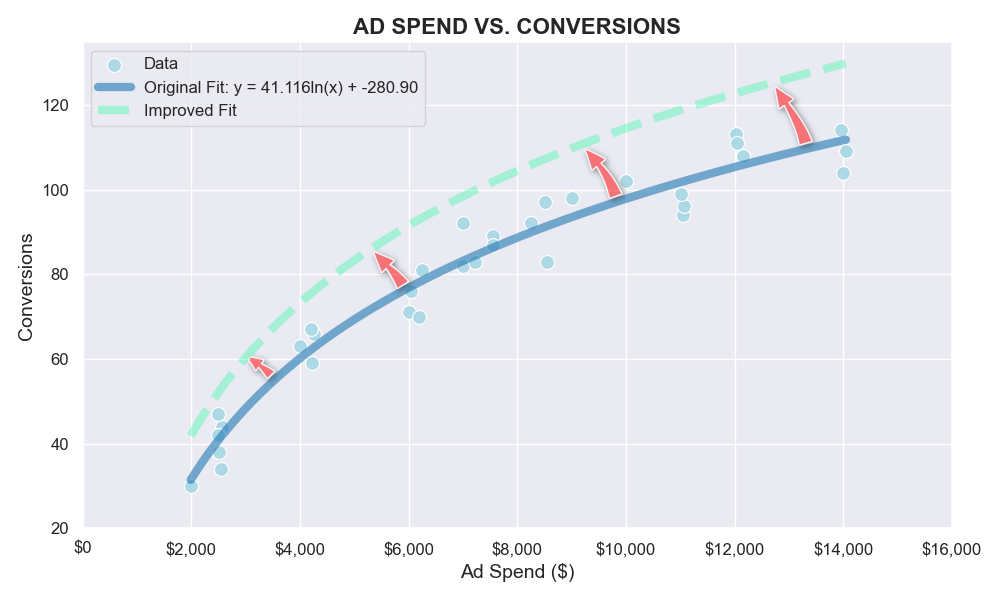
Optimizing the Frontier: Growth Isn’t Static
While the efficient frontier curve depicts diminishing returns, its actual shape can be optimized and pushed outwards through tactics like creative testing and optimization, audience targeting expansions, new ad inventory sources, and automation through machine learning bidding. An improving frontier over time means your campaigns are becoming more efficient at converting ad spend into tangible results through iterative testing of creatives/ad copy, offer or other campaign optimizations.
Note: The Efficient Frontier approach is more suited for strategic budget planning and forecasting linke in this example, while something like a multi-armed bandit algorithm is designed for real-time optimization and dynamic budget allocation of ad campaigns.
Marketers need to own forecasting and budgeting process. And while no forecasting approach is 100% accurate, using a proven methodology grounded in actual campaign data will at least give us more confidence when presenting numbers to the finance teams and defending budget proposals. That said, the best marketers continually analyze new data, re-evaluate and adjust.
What is your experience with planning and forecasting budgets and marketing performance?
Thang Doan is a seasoned growth marketing leader with over 12 years of experience driving results through paid channels, data-driven experimentation, and marketing technology across ecommerce, fintech, software, and AI industries in both B2C and B2B settings. His expertise lies in developing growth strategies and high-volume testing frameworks for user acquisition and engagement, leveraging his deep understanding of experimentation, ad tech infrastructure, and AI automations to drive market leadership.
Feel free to reach out to me to discuss these or other strategies for maximizing ROI in your marketing programs: Connect on LinkedIn